Dashboards
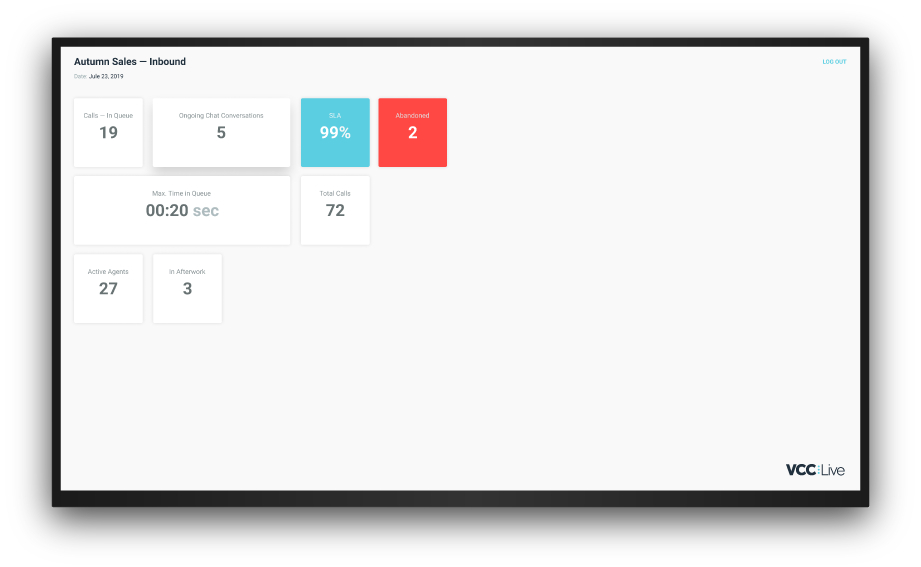
Dashboards allow you to overview your projects’ metrics in real time through a single graphical user interface, so you can monitor your business performance at a glance. And with a single link, you can easily share your Dashboards with others or access them anytime, anywhere, on any device.
Table of Contents
- Features Overview
- Using the Dashboard
- To Access the Dashboard Editor
- To Create a New Dashboard
- To Rename a Dashboard
- To Delete a Dashboard
- Sharing Your Dashboard and Dashboard Authentication
- To Share a Dashboard
- To Revoke Access from a User
- Widgets
- To Add a New Widget to Your Dashboard
- To Delete a Widget
- To Resize a Widget
- To Move a Widget
- Filters
- To Access Filters
- To Create a Filter
- To Edit a Filter
- To View a Filter’s Scope
- Available KPIs
- Inbound statistics KPIs
- Real-time KPIs
- User-based Statistics KPIs – Breaks
- User-based Statistics KPIs – Calls
- User-based Statistics KPIs – Chat
- User-based Statistics KPIs – Commission
- User-based Statistics KPIs – Disposition Outcome
- User-based Statistics KPIs – Disposition Type
- User-based Statistics KPIs – Emails
- User-based Statistics KPIs – Tickets
- User-based Statistics KPIs – Time Tracking
- User-based Statistics KPIs – User States
- User-based Statistics KPIs – VCC Pay
- User-based Statistics KPIs – Quality Management
- Database KPIs – Record information
Features Overview
Easy customization. You can customize what data to display on your Dashboards — including the way data is presented. Change the position and size of the widgets, change the font size, or set up conditional background colors so that you get visual feedback when, for example, inbound calls peak.
Real-time information. Analyze, aggregate, and visualize data about your calls, projects, and users in real time. Dashboards feature widgets — boxes displaying various kinds of real-time information — so your Dashboards always display the most important metrics you need on a single screen.
Link to Share. You can share your Dashboards with a single link, then open it in a browser. This means that you can access your Dashboards on virtually any computing device.
40+ KPIs — and counting. To see a full list of our available KPIs, please refer to the Available KPIs section at the bottom of this page.
Using the Dashboard
To Access the Dashboard Editor
- From the VCC Live menu, select Contact Center > Dashboards.
To Create a New Dashboard
- From the VCC Live menu, select Contact Center > Dashboards.
- Press New dashboard.
- In the New dashboard pane, enter a name for your dashboard.
- Press Save.
To Rename a Dashboard
- From the VCC Live menu, select Contact Center > Dashboards.
- In the All dashboards pane, select the dashboard you want to rename.
- In the Dashboard properties pane, enter a new name for your dashboard.
- Press Save.
To Delete a Dashboard
- From the VCC Live menu, select Contact Center > Dashboards.
- In the All dashboards pane, hover your mouse over the dashboard you want to delete, then press the trash icon.
Sharing Your Dashboard and Dashboard Authentication
You can easily share your Dashboards — using a single URL — with others or access the Dashboards anytime, from anywhere, virtually on any device supporting web browsers.
An authentication screen restricts who can access the Dashboards you share using the Share link. To access a shared Dashboard, a user would need two things:
- a valid, existing VCC Live user account
- the right to access the shared Dashboard
When you share a Dashboard, users will need to log in using their login details to access the dashboard. This means that only those can access your Dashboards who have a valid VCC Live user account in the VCC Live application.
To Share a Dashboard
- From the VCC Live menu, select Contact Center > Dashboards.
- In the Dashboard properties pane, select the link to open the dashboard in your browser.
- A browser window appears displaying your online dashboard. Copy the URL link of the dashboard to share it with others.
To Revoke Access from a User
- Changing a user’s state to Inactive (in VCC Live menu > User Management > Users) will immediately terminate the user’s session, and the user will be logged out.
Widgets
Widgets are small tiles that you can add to your dashboards to populate them. Each widget displays information of a particular type, along with a title, and optional prefix, suffix and unit options. You can also set widgets to change their color depending on the value they display.
To Add a New Widget to Your Dashboard
- From the VCC Live menu, select Contact Center > Dashboards.
- In the New widget pane, enter a title for your widget.
- Optional: Enter a Prefix, Suffix, and Unit for your widget.
- Optional: Besides the New widget label, press + to add background color conditions.
- Use the Title font size, Data font size, and Unit font size controls to adjust the size of texts on the widget.
- In the Filter drop-down list, select a filter option. It controls the scope of the data displayed on the widget.
- In the Field drop-down list, select the data you want to display in the widget.
- Press Save. The widget appears on the screen.
To Delete a Widget
- On the widget you want to delete, press the trash icon.
To Resize a Widget
- Drag the symbol on the left-right corner of the widget, start moving it inwards or outwards to decrease or increase the size of the widget, then once you’re happy with the size of the widget, release the drag.
To Move a Widget
- Drag and drop a widget to move it around or to change the widgets’ order.
Filters
Filters, as their name suggests, are used to define the scope of data displayed on your dashboard’s widgets.
To Access Filters
- From the VCC Live menu, select Contact Center > Dashboards.
- Select the Filters tab.
- Refer to the All filters sheet.
To Create a Filter
- From the VCC Live menu, select Contact Center > Dashboards.
- Select the Filters tab.
- Press New filter.
- Enter a name and description for your filter.
- Use the Choosing projects, Choosing queues, Choosing agents panes to define the scope of the data used.
- In the text fields, start typing, for example the name of a project, project folder, team, queue or agent. Any projects, project folders, teams, or queues match the word or word chunks you are typing in, will be included in the data scope.
- Press Save.
To Edit a Filter
- From the VCC Live menu, select Contact Center > Dashboards.
- Select the Filters tab.
- In the All filters sheet, select the filter you want to edit.
- In the Edit filter pane, edit the details you need.
- Press Save.
To View a Filter’s Scope
- From the VCC Live menu, select Contact Center > Dashboards.
- Select the Filters tab.
- Refer to the Filter information sheet, select the filter you want to edit.
Available KPIs
There are many KPIs available in the Dashboard, and they are separated into three categories: Inbound statistics KPIs, User-based Statistics KPIs and Database KPIs. Below, you can see a comprehensive list of KPIs in each category.
Inbound statistics KPIs
| Name | Description |
|---|---|
| Picked up in time (SLA) | The number of inbound calls answered by the agent within the SLA. |
| Picked up after time | Number of calls answered by an agent after the predefined SLA timeframe. |
| Disconnected in queue within SLA | Number of calls disconnected while in a queue, within the predefined SLA timeframe. |
| Disconnected in IVR | Number of calls disconnected in the IVR. |
| Time in IVR | Time spent in the Interactive Voice Response (IVR – a call is handled by an automated service, before a client is connected to an agent or disconnected). |
| Time in queue | The time the client spent in the queue. |
| Talk Time | Length of the conversation. Call on hold is not included. |
| Early | Number of calls in the queue disconnected within 5 seconds. |
| Disconnected in Queue After SLA | Number of disconnected calls in a queue that exceeded the SLA timeframe. |
| Average waiting time of calls hanged up in queue | The average time the client spent in the queue before hanging up the call. |
| Afterwork | Number of times when agents entered Afterwork status during the specified period. |
| Repeated calls count | Number of calls that are taking place more than once. |
| Calls Answered Within 5 minutes | Number of calls that were answered within 5 minutes in the IVR. |
| Calls Not Answered Within 5 minutes | Number of calls that were not answered within 5 minutes in the IVR. |
Real-time KPIs
Note: The Break codes on your account also appear separately in the list of real-time KPIs; therefore, you can display the number of agents currently on individual breaks one by one.
| Name | Description |
|---|---|
| Afterwork (A) | Number of agents in Afterwork status. |
| All agents | Number of agents logged in to the project. |
| At Agent | Number of calls connected to agents. |
| Available (A) | Number of agents in Available status. |
| Being Transferred | Displays transferred calls. (The value is only displayed once the calls are transmitted in attended transfer or after the transfer is completed during normal transfer. If a transfer hasn’t reached yet the agent within the inbound processes, it displays a blank value.) |
| Break (A) | Number of agents in Break status. |
| Calls In Progress | Number of calls in progress. (Handled by the Dialer algorithm, not yet assigned to an agent.) |
| Calls Needed | Number of calls required to be initiated to keep all agents in Call status. The value is calculated by the Predictive Dialer algorithm. |
| Chat (A) | Number of agents in Chat status. |
| Custom Call (A) | Number of agents in Custom Call status. |
| Email Status | Number of agents in Email status. |
| Failed Calls | Number of initiated calls that have been recently allocated an Unavailable or Temporarily Not Available disposition. It is recommended to monitor this number for an extended period of time (at least 5 to 60 minutes) to get a better understanding of overall performance. |
| In Call | Number of agents in Call status. |
| In Queue After SLA | Number of calls in the queue that exceeded the SLA. |
| In Queue Within SLA | Number of calls in the queue within the SLA. |
| In Queue | Number of calls in the queue. |
| In The IVR | Number of calls in the IVR, before entering a queue. |
| Longest Waiting Time | Maximum time a currently waiting customer has spent in a queue. |
| Ongoing Calls | Number of calls in progress. Includes all calls that reached the client’s phone number (Before Queue + in Queue Within SLA + In Queue After SLA + At Agent). |
| Prework (A) | Number of agents in Prework status. |
| Ticket (A) | Number of agents in Ticket status. |
| Waiting for recall (A) | Number of agents in Waiting for recall status. |
User-based Statistics KPIs – Breaks
| Name | Description |
|---|---|
| Break: technical | Number of technical Break status occurrences. Technical break is the system-default break code in VCC Live – it is applied when an incoming call is not answered by the agent in time (‘in time’ means the time specified in Agent ring time (sec) once a Queue is set up in your project’s inbound processes). It is useful to spot occurrences when agents do not manage to pick up incoming calls. For more information, visit our tutorial on the User State Log. |
| Break: technical (Duration) | Total time of technical Break status durations. Technical break is the system-default break code in VCC Live – it is applied when an incoming call is not answered by the agent in time (‘in time’ means the time specified in Agent ring time (sec) once a Queue is set up in your project’s inbound processes). It is useful to spot occurrences when agents do not manage to pick up incoming calls. For more information, visit our tutorial on the User State Log. |
Note: 2 KPIs will appear for all the breaks that you create on your account. One of them displays the number of such break occurrences, while the other displays the duration spent on them.
User-based Statistics KPIs – Calls
| Name | Description |
|---|---|
| All Dispositions | All calls with allocated dispositions (Sum of calls with Not reached + Reached + Success dispositions). |
| AMD detection | Number of call attempts where an answering machine was detected. |
| Call Cost | Costs charged for the call. |
| Call/Logged In | Time per hour spent in Call. An hour is defined by THE Total Login Time. |
| Efficient Time | Efficiency within a given period. It is a ratio value shown as minutes/hour as per the following formula: total time spent in Call status / Total Login Time. This parameter does not include breaks, so ‘time spent in Call status’ / ‘Login time including breaks’ results in a higher number. This is an important efficiency measure. For the Manual dialing mode, it should be approximately. 20 mins, for Predictive dialing mode, it should be approximately. 30-45. |
| Efficiency (%) | Daily efficiency presented as a percentage. It is calculated as Efficient time/hour. For example, an efficiency time of 00:36:00 means 36/60, which would be 60%. |
| Inbound Calls | Total number of inbound Call status occurrences. |
| Inbound Calls (Duration) | Total time of inbound Call status durations. |
| Inbound Call Attempt | Inbound call attempts for the given dimensions. |
| Outbound Calls | Total number of outbound Call status occurrences. |
| Outbound Calls (Duration) | Total time of outbound Call status durations. |
| Outbound Call Attempt | Outbound call attempts for the given dimensions. |
| Reached/All dispositions | Ratio value as per the following formula: number of Reached records/number of All dispositions, during a given period. |
| Success (%) | Success percentage value, as per the following formula: number of Success calls / number of Reached calls, during a given period. |
| Success/Hour | Number of Success dispositions per hour. An hour is determined by the Total Login Time. |
| Total Call Attempt | Inbound and Outbound call attempts for the given dimensions. |
| Total Reached | Total number of call attempts where the customer was reached. |
User-based Statistics KPIs – Chat
| Name | Description |
|---|---|
| Chats | Total number of chat sessions. |
| Chats Answered After SLA | Number of chat sessions answered by the agent that exceeded the SLA. |
| Chats Answered Within SLA | Number of chat sessions answered by the agent within the SLA. |
| Completed | Number of chat sessions that ended with Completed disposition. |
| First Response Time | The First Response time to chat sessions. |
| Handle Time | The Handle Time of chat sessions. |
| Lost | Number of chat sessions that ended with Lost disposition. |
| Missed | Number of chat sessions that ended with Missed disposition. |
| Response Time | The Response Time of chat sessions. |
| Wait Time (Lost) | The Wait time for customers for lost chat sessions. |
| Wait Time (Missed) | The Wait time for customers for missed chat sessions. |
User-based Statistics KPIs – Commission
| Name | Description |
|---|---|
| Agent Commission | Agent fee, as specified in Dispositions > General settings > Agent commission |
| Agent Commission (Disposition Based) | Agent fee, as specified in Dispositions > General settings > Agent commission |
| Agent Commission (Field Based) | Agent fee, calculated from field settings |
| CC Commission | Call center fee, as specified in Dispositions > General settings > Call center commission |
| CC Commission (Disposition Based) | Call center fee, as specified in Dispositions > General settings > Call center commission |
| CC Commission (Field Based) | Call center fee, calculated from field settings |
User-based Statistics KPIs – Disposition Outcome
| Name | Description |
|---|---|
| Not Reached | Number of calls allocated a Not Reached disposition during a given period. |
| Reached | Number of calls allocated a Reached and Success disposition during a given period. |
| Successful | Number of calls allocated a Success disposition during a given period. |
User-based Statistics KPIs – Disposition Type
| Name | Description |
|---|---|
| Anonymized Records | Total number of Anonymized dispositions during a given period. |
| Answering Machine | Total number of Answering Machine dispositions during a given period. |
| Busy | Total number of Busy dispositions during a given period. |
| Callback | Total number of Callback dispositions during a given period. |
| Channel Limit Exceeded | Total number of Channel Limit Exceeded dispositions during a given period. |
| Discard | Total number of Discard dispositions during a given period. |
| Discard (Wrong Number) | Total number of Discard (Wrong Number) dispositions during a given period. |
| Discarded (Robinson) | Total number of Discarded (Robinson) dispositions during a given period. |
| Dropped | Total number of Dropped calls during a given period. |
| Finished | Total number of Finished dispositions during a given period. |
| Machine | Total number of Machine dispositions during a given period. |
| Quota | Total number of Quota dispositions during a given period. |
| Robinson List | Total number of Robinson List dispositions during a given period. |
| Shared Callback | Total number of Shared Callback dispositions during a given period. |
| Temporary Unavailable | Total number of Temporary Unavailable dispositions during a given period. |
| Unavailable | Total number of Unavailable dispositions during a given period. |
User-based Statistics KPIs – Emails
| Name | Description |
|---|---|
| Agent Email (Bounced) | Number of agent emails that received a Bounced event. |
| Agent Email (Delivered) | Number of agent emails that received a Delivered event. |
| Agent Email (Dropped) | Number of agent emails that received a Dropped event. |
| Agent Email (Link Clicks) | Number of agent emails that received a Link Clicks event. |
| Agent Email (Marked As Spam) | Number of agent emails that received a Marked As Spam event. |
| Agent Email (Opened) | Number of agent emails that received an Opened event. |
| Agent Email (Response) | Number of agent emails that received a Response event. |
| Agent Email (Sent) | Number of agent emails that received a Sent event. |
| Agent Email (Unsubscribed) | Number of agent emails that received an Unsubscribed event. |
| Avg. Emails Assigned to Ticket Time | The average time it takes to assign emails to tickets. |
| Disposition Email (Bounced) | Number of disposition emails that received a Bounced event. |
| Disposition Email (Delivered) | Number of disposition emails that received a Delivered event. |
| Disposition Email (Dropped) | Number of disposition emails that received a Dropped event. |
| Disposition Email (Link Clicks) | Number of disposition emails that received a Link Clicks event. |
| Disposition Email (Marked As Spam) | Number of disposition emails that received a Marked As Spam event. |
| Disposition Email (Opened) | Number of disposition emails that received an Opened event. |
| Disposition Email (Response) | Number of disposition emails that received a Response event. |
| Disposition Email (Sent) | Number of disposition emails that received a Sent event. |
| Disposition Email (Unsubscribed) | Number of disposition emails that received an Unsubscribed event. |
| Emails Answered After SLA | Number of inbound emails answered by the agent that exceeded the SLA. |
| Emails Answered Within SLA | Number of inbound emails answered by the agent within the SLA. |
| Emails Assigned to Ticket | Number of emails assigned to a ticket in the given period. |
| Emails Assigned to Ticket Time | The time of assigning emails to tickets. |
| External (VCC Live Email) sent emails (by system) | The number of emails sent by the system using the VCC Live Email connection in the given period. |
| External (VCC Live Email) sent emails (by users) | The number of emails sent via agents using the VCC Live Email connection in the given period. |
| External (VCC Live Email) sent emails (total) | The number of emails sent via the VCC Live Email connection in the given period. |
| Mass Email (Bounced) | Number of mass emails that received a Bounced event. |
| Mass Email (Delivered) | Number of mass emails that received a Delivered event. |
| Mass Email (Dropped) | Number of mass emails that received a Dropped event. |
| Mass Email (Link Clicks) | Number of mass emails that received a Link Clicks event. |
| Mass Email (Marked As Spam) | Number of mass emails that received a Marked As Spam event. |
| Mass Email (Opened) | Number of mass emails that received an Opened event. |
| Mass Email (Response) | Number of mass emails that received a Response event. |
| Mass Email (Sent) | Number of mass emails that received a Sent event. |
| Mass Email (Unsubscribed) | Number of mass emails that received an Unsubscribed event. |
| SMTP sent emails | The number of emails sent via SMTP in the given period. |
User-based Statistics KPIs – Tickets
| Name | Description |
|---|---|
| Closed Tickets | The number of closed tickets. |
| Tickets | The number of created tickets. |
| Tickets Not Resolved on First Contact | The number of tickets not resolved on first contact. |
| Tickets Not Resolved on First Contact (Total Time) | The total time spent on tickets not resolved on first contact. |
| Tickets Resolved on First Contact | The number of tickets resolved on first contact. |
| Tickets Resolved on First Contact (Total Time) | The total time spent on tickets resolved on first contact. |
User-based Statistics KPIs – Time Tracking
| Name | Description |
|---|---|
| Time Tracking: Count of Call Panel Events – Active | The number of occurrences when agents navigated to the call panel in VCC Live 360, while it was the active browser tab. |
| Time Tracking: Count of Call Panel Events – Inactive | The number of occurrences when agents navigated to the call panel in VCC Live 360, while it was not the active browser tab. |
| Time Tracking: Count of Chat Panel Events – Active | The number of occurrences when agents navigated to the chat panel in VCC Live 360, while it was the active browser tab. |
| Time Tracking: Count of Chat Panel Events – Inactive | The number of occurrences when agents navigated to the chat panel in VCC Live 360, while it was not the active browser tab. |
| Time Tracking: Count of Custom Call Panel Events – Active | The number of occurrences when agents navigated to the custom call panel in VCC Live 360, while it was the active browser tab. |
| Time Tracking: Count of Custom Call Panel Events – Inactive | The number of occurrences when agents navigated to the custom call panel in VCC Live 360, while it was not the active browser tab. |
| Time Tracking: Count of Customer Panel Events – Active | The number of occurrences when agents navigated to the customer panel in VCC Live 360, while it was the active browser tab. |
| Time Tracking: Count of Customer Panel Events – Inactive | The number of occurrences when agents navigated to the customer panel in VCC Live 360, while it was not the active browser tab. |
| Time Tracking: Count of Email Panel Events – Active | The number of occurrences when agents navigated to the email panel in VCC Live 360, while it was the active browser tab. |
| Time Tracking: Count of Email Panel Events – Inactive | The number of occurrences when agents navigated to the email panel in VCC Live 360, while it was not the active browser tab. |
| Time Tracking: Count of Idle Panel Events – Active | The number of occurrences when agents navigated to the idle panel in VCC Live 360, while it was the active browser tab. |
| Time Tracking: Count of Idle Panel Events – Inactive | The number of occurrences when agents navigated to the idle panel in VCC Live 360, while it was not the active browser tab. |
| Time Tracking: Count of Ticket Panel Events – Active | The number of occurrences when agents navigated to the ticket panel in VCC Live 360, while it was the active browser tab. |
| Time Tracking: Count of Ticket Panel Events – Inactive | The number of occurrences when agents navigated to the ticket panel in VCC Live 360, while it was not the active browser tab. |
| Time Tracking: Time Spent on Call Panel – Active | Total time spent when agents navigated to the call panel in VCC Live 360, while it was the active browser tab. |
| Time Tracking: Time Spent on Call Panel – Inactive | Total time spent when agents navigated to the call panel in VCC Live 360, while it was not the active browser tab. |
| Time Tracking: Time Spent on Chat Panel – Active | Total time spent when agents navigated to the chat panel in VCC Live 360, while it was the active browser tab. |
| Time Tracking: Time Spent on Chat Panel – Inactive | Total time spent when agents navigated to the chat panel in VCC Live 360, while it was not the active browser tab. |
| Time Tracking: Time Spent on Custom Call Panel – Active | Total time spent when agents navigated to the custom call panel in VCC Live 360, while it was the active browser tab. |
| Time Tracking: Time Spent on Custom Call Panel – Inactive | Total time spent when agents navigated to the custom call panel in VCC Live 360, while it was not the active browser tab. |
| Time Tracking: Time Spent on Customer Panel – Active | Total time spent when agents navigated to the customer panel in VCC Live 360, while it was the active browser tab. |
| Time Tracking: Time Spent on Customer Panel – Inactive | Total time spent when agents navigated to the customer panel in VCC Live 360, while it was not the active browser tab. |
| Time Tracking: Time Spent on Email Panel – Active | Total time spent when agents navigated to the email panel in VCC Live 360, while it was the active browser tab. |
| Time Tracking: Time Spent on Email Panel – Inactive | Total time spent when agents navigated to the email panel in VCC Live 360, while it was not the active browser tab. |
| Time Tracking: Time Spent on Idle Panel – Active | Total time spent when agents navigated to the idle panel in VCC Live 360, while it was the active browser tab. |
| Time Tracking: Time Spent on Idle Panel – Inactive | Total time spent when agents navigated to the idle panel in VCC Live 360, while it was not the active browser tab. |
| Time Tracking: Time Spent on Ticket Panel – Active | Total time spent when agents navigated to the ticket panel in VCC Live 360, while it was the active browser tab. |
| Time Tracking: Time Spent on Ticket Panel – Inactive | Total time spent when agents navigated to the ticket panel in VCC Live 360, while it was not the active browser tab. |
| Time Tracking: Call | The number of occurrences when agents navigated to the call panel in VCC Live 360. |
| Time Tracking: Chat | The number of occurrences when agents navigated to the chat panel in VCC Live 360. |
| Time Tracking: Custom Call | The number of occurrences when agents navigated to the custom call panel in VCC Live 360. |
| Time Tracking: Customer | The number of occurrences when agents navigated to the customer panel in VCC Live 360. |
| Time Tracking: Email | The number of occurrences when agents navigated to the email panel in VCC Live 360. |
| Time Tracking: Idle | The number of occurrences when agents navigated to the idle panel in VCC Live 360. |
| Time Tracking: Ticket | The number of occurrences when agents navigated to the ticket panel in VCC Live 360. |
| Total Time Tracking: Time Spent on Call Panel | Total time spent when agents navigated to the call panel in VCC Live 360. |
| Total Time Tracking: Time Spent on Chat Panel | Total time spent when agents navigated to the chat panel in VCC Live 360. |
| Total Time Tracking: Time Spent on Custom Call Panel | Total time spent when agents navigated to the custom call panel in VCC Live 360. |
| Total Time Tracking: Time Spent on Customer Panel | Total time spent when agents navigated to the customer panel in VCC Live 360. |
| Total Time Tracking: Time Spent on Email Panel | Total time spent when agents navigated to the email panel in VCC Live 360. |
| Total Time Tracking: Time Spent on Idle Panel | Total time spent when agents navigated to the idle panel in VCC Live 360. |
| Total Time Tracking: Time Spent on Ticket Panel | Total time spent when agents navigated to the ticket panel in VCC Live 360. |
User-based Statistics KPIs – User States
| Name | Description |
|---|---|
| Afterwork (Duration) | Total time spent in Afterwork status. (I.e., after ending the call and before the agent defines a disposition.) |
| Available (Duration) | Total time spent in Available status (I.e., after logging in to a project and before starting to work on a record) |
| Avg. Afterwork Time | The average length of Afterwork status. It is based on ‘total time spent in Afterwork status’ / the number of occurrences of ‘Afterwork status’. |
| Avg. Available | The average length of Available status. It is based on ‘total time spent in Available status’ / the number of occurrences of ‘Available status’. |
| Avg. Call Time | The average length of Call status. It is based on ‘total time spent in call status’ / the number of occurrences of ‘Call status’. |
| Avg. Handle Time | The average length of handling calls. Includes Prework, Ringing status, Talk time, After call work. If no agent was connected, the value is zero. |
| Avg. Prework | The average length of Prework status. It is based on ‘total time spent in Prework status’ / the number of occurrences of ‘Prework status’. |
| Avg. Ringing Time | The average length of Ringing status. It is based on ‘total time spent in Ringing status’ / the number of occurrences of ‘Ringing status’. |
| Break | Total number of Break status occurrences by all agents. |
| Break (Duration) | Total time spent in Break status. It is an important efficiency measure, which should be verified per agent as per the following formula: Break (duration) / Total login time (duration). It is recommended to keep the resulting value below 0,18. |
| Call (Duration) | Total time spent in Call status. (I.e., the agent and the customer are connected and the conversation is in progress.) |
| Chat (Duration) | Total time spent in Chat status. |
| Custom Call | Total number of Custom call status occurrences. (I.e, a call the agent and the customer agreed on previously, and the conversation is in progress.) |
| Custom Call (Duration) | Total time spent in Custom call status. (I.e., a call the agent and the customer agreed on previously, and the conversation is in progress.) |
| Custom Hold | Total number of Custom hold status occurrences. (I.e., the call is not terminated, yet a conversation is not possible until the custom call is removed from Hold to Call status.) |
| Custom Hold (Duration) | Total time spent in Custom hold status. (I.e., the call is not terminated, yet a conversation is not possible until the custom call is removed from Hold to Call status.) |
| Custom Ringing | Total number of occurrences in Custom Ringing status. (I.e., after initiating a custom call and before the customer answers that call.) Available in Manual mode only. |
| Custom Ringing (Time) | Total time spent in Custom ringing status. (I.e., after initiating a custom call and before the customer answers that call.) Available in Manual mode only. |
| Custom Ringing In | Total number of Custom Ringing status occurrences where a transfer of Custom call is received. |
| Custom Ringing In (Duration) | Total time spent in Custom Ringing In status. |
| Custom Ringing Out | Total number of Custom Ringing status occurrences where a transfer of Custom call is initiated. |
| Custom Ringing Out (Duration) | Total time spent in Custom Ringing Out status. |
| Email (Duration) | Total time the agent spent in Email status. (I.e., reading and replying to emails.) |
| Handling Time | The time the agent spent working on the record. Includes Prework, Ringing, Talk time, After call work. If no agent was connected, the value is zero. |
| Hold (Duration) | Total time spent while on Hold. (I.e., the call is not terminated, yet a conversation is not possible until the call is removed from Hold to Call status. This can happen multiple times during one conversation.) |
| Outbound Attended Transfer (Duration) | Total time spent in Outbound Attended Transfer Status. |
| Inbound Attended Transfer (Duration) | Total time spent in Inbound Attended Transfer Status. |
| Prework (Duration) | Total time spent in Prework status (I.e., after opening a record and before initiating the call). Available in Manual mode only. |
| Ringing | Total time spent in Ringing status. (I.e., after initiating a call and before the customer answers the call.) Available only in Manual mode. |
| Ringing In (Duration) | Total time spent in Ringing In status. |
| Ringing Out (Duration) | Total time spent in Ringing Out status. |
| Ticket (Duration) | Total time the agent spent in Ticket status. (I.e., reading and replying to tickets.) |
| Total Login Time | Time spent between login and logout during a given period. |
| Total Login Time Excluding Breaks | Time spent between login and logout during a given period, not including time spent on breaks. |
| Transfer To Agent Status | Total time spent in Transfer to Agent status (I.e, the call is being transferred to another agent + the transferred call is in progress). |
| Unavailable (Duration) | Total time spent in Unavailable status. (I.e., after logging in and before selecting a project.) |
| Waiting for Callback (Duration) | Total time spent in Waiting for Call status. (I.e., idle time until the agent is connected to a call.) |
User-based Statistics KPIs – VCC Pay
| Name | Description |
|---|---|
| VCC Pay EUR transaction count | The number of VCC Pay transactions done in EUR currency. |
| VCC Pay EUR transaction value | The total value of the VCC Pay transaction done in EUR currency. |
| VCC Pay HUF transaction count | The number of VCC Pay transactions done in HUF currency. |
| VCC Pay HUF transaction value | The total value of the VCC Pay transaction done in HUF currency. |
| VCC Pay USD transaction count | The number of VCC Pay transactions done in USD currency. |
| VCC Pay USD transaction value | The total value of the VCC Pay transaction done in USD currency. |
User-based Statistics KPIs – Quality Management
| Name | Description |
|---|---|
| QM Assessment Count | The count of QM Assessments given to a user in a given period. |
| QM Assessment Maximum | The maximum value that the user could have reached in the Quality Management Assessments in the given period. |
| QM Assessment Reached Score | The actual value that the user has reached in the Quality Management Assessments in the given period. |
| QM Assessment Percentage | Calculated Custom KPI, the share of QM Assessment Reached Score, and QM Assessment Maximum. |
Database KPIs – Record information
| Name | Description |
|---|---|
| Database Size | Number of records in a database. |
| Instantly Callable | Number of records available to be called at a given moment. The system considers next_contact, which is then handled by the dialer. Callbacks that already belong to agents, dropped calls, and voicemail are excluded. |
| Available to Call | Records still to be called that have anything apart from a Finished disposition. |
| New Records | The number of records that are considered new for the dialer in the project’s database. |
| New Records With 0 Attempts | The number of records that are considered new for the dialer in the project’s database, and there were previously no call attempts. |
Related articles
There's always more to learn. Discover similar features by visiting related articles:





Comments
Can’t find what you need? Use the comment section below to connect with others, get answers from our experts, or share your ideas with us.
There are no comments yet.