


Outbound-Related Statistics
Estimated reading time: 26 minutes | Target users: Supervisors
In this tutorial, you will learn where to search for all the information regarding your outbound calls, and how to monitor the most important metrics and KPIs in your projects.
Tracking your outbound traffic is essential if you want to get a clear understanding of a project’s performance. This is why you extract and export sets of data you find most relevant to evaluate later. But what are the key aspects you should consider when gathering information from your calls? This tutorial introduces you to the main points you should consider when collecting data, monitoring logs and exporting statistics.
In this lesson, you will learn:
- Where to search for statistics related to Outbound Calls
- The most important statistics to pay attention to
- How to personalize your reports
1. Find Your Relevant Outbound Call Statistics
Statistics for your outbound calls are summarized either as information for a specific project (Project-related logs and statistics) or information connected to all your projects (Global logs and statistics). As they highlight different aspects of your outbound calls, we have listed them separately here as well.
1.1 Project-Related Logs and Statistics
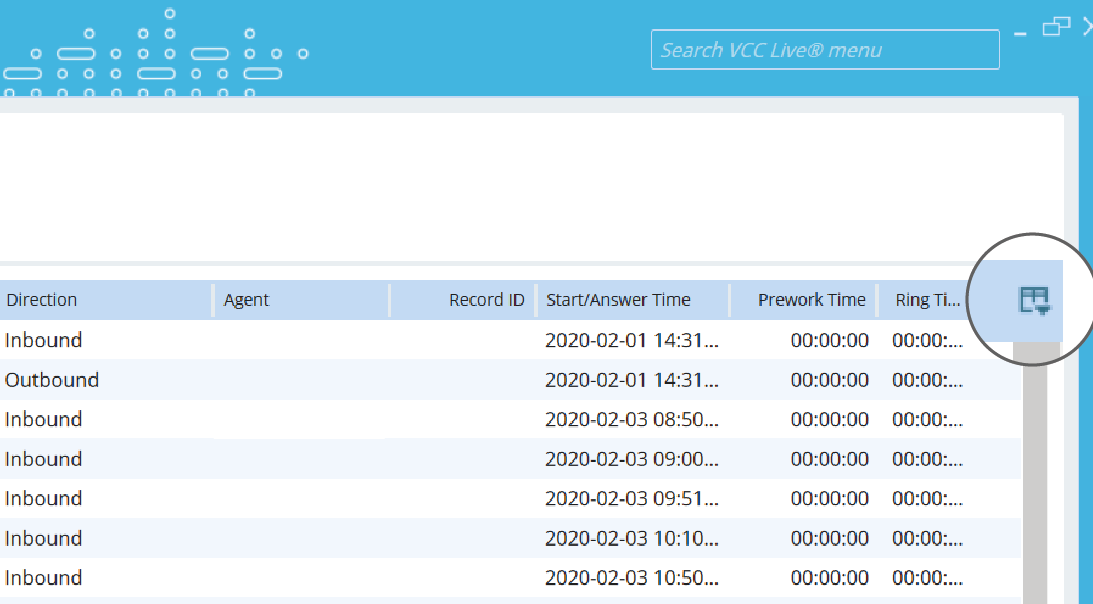
CDR Log: CDR stands for Call Details Records, and by navigating to VCC Live’s CDR Log screen you can access a number of important aspects for all your call attempts, such as which agent handled the call, the time and date of the call, record ID, call cost or time spent in agent statuses. The CDR Log also lets you access call recordings, allowing you to download, delete or permanently delete your call recordings.
- Click on the Direction column to group call events into Inbound and Outbound sections.
- If you wish to extend your CDR Log, you can add further Fields from your Database. Click on the
 button at the upper right corner of the table, and add or remove additional information columns to your log. In order to do this, first you need to enable this feature in the Database > Fields section. Select your fields, then select one of the options in the Include in CDR log as dropdown list. Once you have selected your fields, they can be then added to your CDR Log.
 - It is possible to comment on specific aspects of the recording with the built-in Quality Management tool. To access the QM tool, click on the icon next to a listed call event, which you can find in the corresponding column.
- This log can be found at Project > Logs and statistics > CDR log.
Project-Specific Call Statistics: These statistics provide summarized information of all outgoing call results. This section focuses on the record information specific to your selected project, such as the number of records with Success, Reached or Unreached dispositions. Call statistics break down your data by agent, date and time, and can be expanded or collapsed in the Dimension column.
- Besides the duration of your agents’ statuses, it is possible to view the quantities and average values of the mentioned statuses too (Avg. Call Time, (Avg. After Call Work, etc.)
- These statistics can be found at Project > Logs and statistics.
Database: Here you can take a look at the current status of your project’s database, broken down into sections based on record availability.
- In the Total section at the top of the screen you can see the total size of the database, listed as:
- Callable records – that is, all records which do not have a Finished disposition
- Non-callable records – that is, all records that are still available to call with a “next scheduled call time” in the future, and
- Finished records – that is, all records with a Finished disposition. This also includes all system-finished dispositions, such as Discard, Discard (Wrong Number) and Discard Robinson, as well as records closed by the Quota feature.
- To illustrate these values in an easier way, a pie chart appears next to your data, showing the relative size of the three subsections along with their percentage value.
- Further down, a detailed list of Total is shown, including values for New records, Shared callbacks etc. To illustrate these records in an easier way, a horizontal bar graph appears next to your data, showing the relative size of the listed values.
- At the bottom of the screen, you can find a table of New or Not handled by agent records sorted by attempts. This represents the number of attempts handled by the dialer so far to these mentioned records. Next to the table, a horizontal bar graph helps to visualize the depicted values.
Records list: By extending the Database section, more useful information can be found in the Records list tab. Here you can perform a specified search action using filters, keywords and search terms. Please note, however, that the list you get here may be the result of either inbound or outbound calls, or manual changes.
- The Records list gives you an overview of your records, and lets you view, search and mass modify records in your projects.
- The list displays the current state of your records.
- If you want to narrow down your results, use the Extended filter parameters tab, where you can find more fields and filters to customize your search results.
Quota: As with the Records list, the Quota window is nested under the Database section. This menu displays a summarized information of quota-relevant records.
- Check the total number of records for your project, listed in the same structure as you set it up in Project > Database > Fields. In the table in the bottom right-hand corner of the screen you can find the cell quota pane, sorted into three columns. In the first column you can see and edit the Value set for a specific quota; the second and third columns show the Current value and the Records left value respectively, which serve as useful monitoring tools to help track the progress of your quota project.

- You can only use this section to sort your records if you have set up quota fields in your project.
- Find out more information about VCC Live’s Quota tool on our website.

1.2 Global Logs and Statistics
Project independent CDR search: As with the CDR Log listed above, the Project independent CDR search contains all inbound and outbound call data, and lists results for multiple projects. This is particularly useful if you want to see a history of all contacts with the customer from different projects or to get a clear overview of an agent’s activity across a number of projects.
- As its name suggests, the main strength of this screen is its Search and Filtering section. It allows you to search for records across multiple projects. For example, you can display all contact attempts from various projects to a selected client, based on client ID or phone number.
- Please note, that unlike in the Project-Specific CDR log, this section has some limitations:
- Not all fields found in the CDR log can be displayed here
- No more than 500 records can be displayed at once
- This screen can be found at VCC Live menu > Logs and Statistics > Project independent CDR search.
Global call statistics: This section displays global information regarding all calls in your projects. You are able to specify a date or date range you wish to evaluate by using the date range picker tool; you can then see the listed records, grouped by Project, Agent and Date dimensions.
- With Global call statistics, you can efficiently track your projects’ efficiency and see information on outgoing call results based on their disposition outcomes, database state or time in a specific user status.
- Please note that the disposition outcomes shown here also include data entered by supervisors, therefore the numbers you see here may differ from what you will see in Project-Specific Call Statistics.
- This statistics can be found at VCC Live menu > Logs and Statistics > Global call statistics.
1.3 More sources which feature Outbound-related statistics
Besides project-specific and global statistics, there are more measuring tools that are valuable for your outbound-related evaluations. If you are interested in other aspects of outbound statistics, let’s take a look at the below list.
User-Based Statistics: The main focus in this measurement tool is to gather various data sources into one place. You can select whether you want to show data focusing on Users, Projects or Dates.
- Besides calls, this metric shows various Sent Email types (Agent Emails, Disposition Emails and Mass Emails) as well as Call Cost, all featuring an Advanced Search field.
- This screen can be found at VCC Live menu > Logs and Statistics > User-Based Statistics.
Call wallboard: Call wallboard displays outbound-related statistics to present an up-to-date daily status of your outbound projects, as it is refreshing at regular intervals. Call wallboard is based on the Global call statistics, enhanced with an auto-refresh option.
- In the upper section of the window, you can specify the Refresh time (sec) or add a custom column for your statistics.
- It is important to note that if you create a new custom column it will appear in all types of statistics. Users can utilize the self-created columns, but to avoid circular references only those that appear at the top of the list can be used. It is important to mention that time-typed values are based on seconds, so if we want to calculate an hourly data, the sum should be divided by 3600.
- This screen can be found at VCC Live menu > Logs and Statistics > Call wallboard.
Dashboards: With a highly customizable interface and clean look, Dashboards can present a number of outbound-related statistics and KPIs in the order and size you wish to present them.
- Dashboards can include multiple outbound-related KPIs from different sources.
- You can include custom calculations based on available measurements.
- You are able to highlight values that diverge from the desired range
- You can display dashboards on external equipment, including mobile devices
- The Dashboards setup interface can be found at VCC Live menu > Logs and Statistics > Dashboards
API: Using an API (Application Programming Interface) allows your system and the VCC Live server to exchange database information through HTTP GET, PUT, POST and DELETE requests. This applies to outbound-related call information as well. Apply the GET request for the CDR log, Call statistics and Disposition statistics in order to send data via an API request to your system from the VCC Live server.
Learn more about the features, location and testing of API for VCC Live using the provided links.
2. The most important Outbound-related KPIs and Measures
Now that you are familiar with the many screens, logs and statistics where you can find a myriad of performance metrics, you may be thinking which are the most important metrics you should really pay attention to? In the table below, we compiled the most essential performance indicators to look for.
Note: When using metrics in the CDR, use the Advanced Search options pane by opening an additional window with the small arrow button, then select the Extended tab and choose Outbound in the Direction section.
| KPI name | Description | Location, calculation | Target value |
|---|---|---|---|
| Number of call attempts | Number of all attempted calls, including the ones that were not established. | CDR log – all rows | N/A |
| Dropped calls | Number of calls that reached the recipient, but there were not enough available agents to handle the established calls and calls were thus disconnected after the specified Waiting time in queue (sec). | CDR log, where Talktime = 0 AND Queue time =/= 0. | N/A |
| Dropped ratio | Percentage of reached calls that were dropped. | CDR log: formula to calculate this ratio: “Dropped calls as above/(Dropped calls as above + number of calls in CDR log, where Talktime > 0)” | <5% |
| Hold time | The total time the client was placed on hold. There are two options where a client may be on hold: 1. When a call is answered but there are no available agents to handle the call. 2. When an agent puts a client on hold during a call. |
1. CDR log, Queue time column 2. CDR log, Hold time column 2. Call statistics, Hold Time column 2. Global call statistics, Hold Time column 2. Dashboards, User-Based Statistics KPIs, Hold (Duration) |
0 |
| Reached call attempts | Number of outgoing calls picked up by a recipient | CDR log, where Talktime > 0 CDR log, Disposition Outcome Reached OR Successful (these are instances where Dispositions are assigned appropriately properly and you want to exclude Voicemails from the Reached calls calculation) |
N/A |
| Reachability/ Hit rate | Ratio value for outgoing call attempts picked up by a recipient, compared to all call attempts. | CDR log, Talktime > 0 / number of all call attempts in CDR log CDR log, (Disposition Outcome = Reached or Successful) / number of all call attempts in CDR log |
The higher, the better. |
| Successful call attempts | Number of outgoing calls picked up by a recipient and closed with a Success disposition. | CDR log, where Disposition Outcome = Successful | The higher, the better |
| Success rate/ Conversion rate | Conversion rate: Number of successful call attempts/reached call attempts | CDR log, Successful Disposition Outcomes / Talk =/= 0 CDR log, Successful Disposition Outcomes /Reached OR Successful Disposition Outcomes |
The higher, the better |
| Penetration rate | Number of finished records/all records in the project’s database | Database: Finished records % Real-Time Monitoring, outbound section: Utilization rate Global call statistics: (Database size – Callable records) / Database size Records list, Number of Finished disposition records / number of all records Note: this latter also includes all system-finished dispositions: Discard, Discard (Wrong number) and Discard Robinson, as well as records closed by the Quota feature |
N/A |
| Available records | Number of records still available to dial. | Database: Callable records Real-Time Monitoring, outbound section: Available to call Global call statistics: Available to Call |
The higher, the better |
| Instantly callable records | Number of records available to be called at a given moment. The system considers next_contact, which is then handled by the dialer. Callbacks that already belong to agents, Dropped calls, and voicemail are excluded. | Real-Time Monitoring, outbound section: Instantly Callable Global call statistics: Instantly Callable |
The more, the better |
| Efficiency | The efficiency KPI can be measured in two possible ways: 1. It includes breaks in agent work time. In this case the following calculation is used: Time spent in Call status/ total logged in time including breaks. 2.It excludes breaks from agent work time. In this case the following calculation is used: Time spent in Call status/ total logged in time excluding breaks It is also a common practice to decide the amount of break time to include in your calculation, or you can choose only certain types of breaks to create a Custom Efficiency calculation. |
1.Global call statistics, Efficient Time 1.Call statistics, Efficiency 1.Dashboards,Efficiency As an alternative, you can also use a custom calculation method to measure your project’s efficiency. |
Including breaks: Predictive: 30-40 mins. Power: 25-35mins. Manual: not more than 25 mins. Excluding breaks: Predictive: 35-45 mins. Power: 30-40 Manual: not more than 25 mins. Note: Efficiency that leaves breaks out of the calculation results in a higher value than Efficiency that includes breaks. |
| Efficiency (%) | The above-mentioned efficiency measures can be presented as a percentage value of an hour. For example, an efficiency of 20 mins means 33,3% | Global call statistics, Efficiency (%) Call statistics, Efficiency (%) Dashboards, Efficiency (%) |
See above for reference |
3. Personalize Your Records
You can check the metrics you are looking for more efficiently by customizing logs and statistics based on your own specific needs. The section below contains some useful tips to help you speed up your workflow.
3.1 Select only the necessary columns
In each of the statistics tables at the upper right-hand corner, you can open a list of all available columns.
- Click on the columns you want to see in your report, and a check mark will appear next to them.
- Click on the columns you do not want to see in your report. The check mark will disappear for each of these.
3.2 Customize your Dashboards
Dashboards in VCC Live are modular and easily configurable. You can select a number of KPIs for your Outbound-related statistics, and then resize or reposition them in any way you want. You can find further information on how to configure and use Dashboards in our user guide here.
3.3 Create the export reports you need
VCC Live’s Export Editor lets you not only design the structure of your reports, but also save them as templates for further use.
Using the Export Editor
- Go to the VCC Live menu, then select Contact Center > Export Editor.
- Click on the small Plus icon to create a New template.
- Enter a name for your template, drag and drop a team to the Added column in order to make your template active for the selected team, then press Save.
- The created template is now active. In the middle of the screen you can find the empty ‘Header’ field, which will show the headers you chose for your export. In Field source, a list of available metrics can be found in the rightmost column. You can choose a different set of metrics list (along with custom headers) by opening the drop down menu in the upper right-hand corner of the screen and selecting another field set.
- Drag and drop your selected fields from the Field source to the Header section. Tip: if you want to change the order, you can do that by dragging a label up or down in the list.
Using the Mass Export tool
- Once you have created your template, go to the VCC Live menu, then select Contact Center > Mass export.
- Select the project you want to extract data from, then press Select dispositions.
- Select the template you want to use – you will find the template you have just created in the drop-down list.
- A number of additional options can be found here, such as export file format options, date range filter, etc. Once you have set your preferences, press Export.
- Save the export file. You may then use it with your preferred datasheet or data-management application.
Optional: You can use an export template for sending you reports on a daily basis. To do so, once you have your mass export ready:
- Go to the Report preferences tab and type your report name in the Name field
- By marking a checkbox, select an email address you want your export to be sent to.
If you want to edit an already-existing export template, choose the template from the list below the Name field and edit the necessary information.
Use export template to export your project data
You can export data from your current project using the Export section of the Database screen.
- Navigate to Project -> Database -> Export
- Select the template you want to use for your export.
- Choose your filter options. It can affect the date range or the export value of the data you want to export.
- Select the structure format you wish to apply to your export in Output file preferences.
- Your export’s header can be either a label ID or the label itself
- Records can be grouped by the numbers after the last underscore in the field names.
- Set up an additional filter by selecting dispositions you want to include in your export from the right-hand column.
- Press Export.
3.4. API filtering options
Create a customized data export with API Requests. A list of selectable options for the exported report, along with an example, can be found on the links below:
Comments
Can’t find what you need? Use the comment section below to connect with others, get answers from our experts, or share your ideas with us.
There are no comments yet.