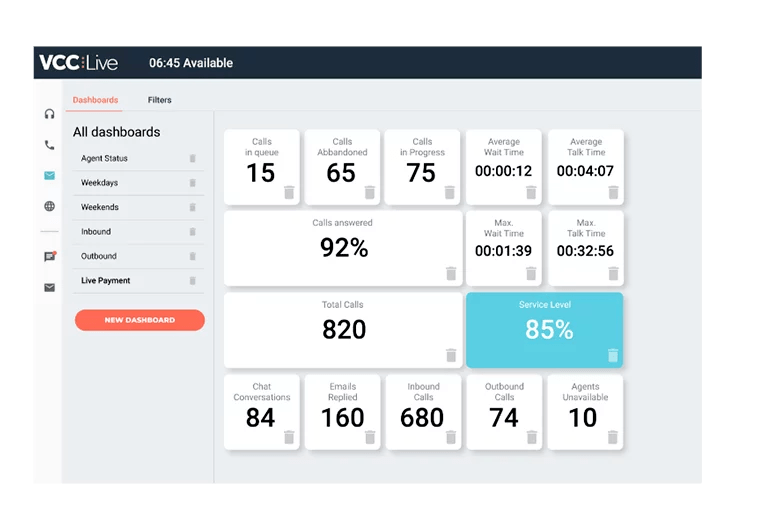
Track and display KPIs in a way that is meaningful to your team. Choose from a wide range of system metrics or set up your own with a few clicks, and organize your dashboard with an easy drag-and-drop method. Set thresholds for your KPIs and SLAs combined with color coding, so the team can always know whether they’re on the right track just by looking at the dashboard.
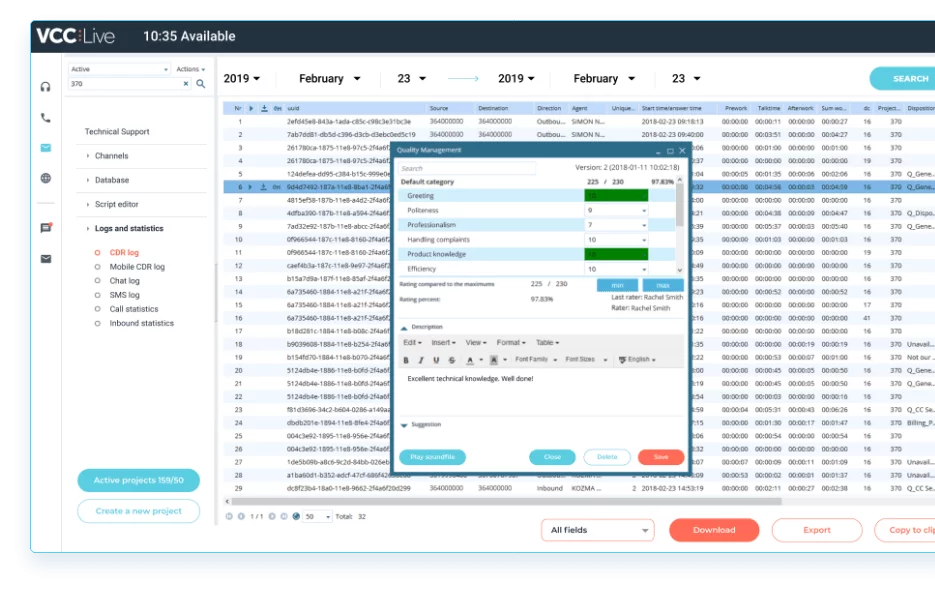
To see the full picture of your contact center operations, display data from across all channels in one place. Export data and create reports with just a few clicks, and share them easily with external users, such as stakeholders, decision makers and other departments who don’t necessarily have access to the software.


